

Executive Summary#
What Changed Since July#
This is a new view, not a continuation of the unsuccessful January and February gold calls. Those trades had explicit price targets and were invalidated when real yields rose beyond their stated thresholds. The present question is whether the subsequent improvement in physical and investment demand is strong enough to offset that higher-yield regime.
Three pieces of evidence shifted positively.
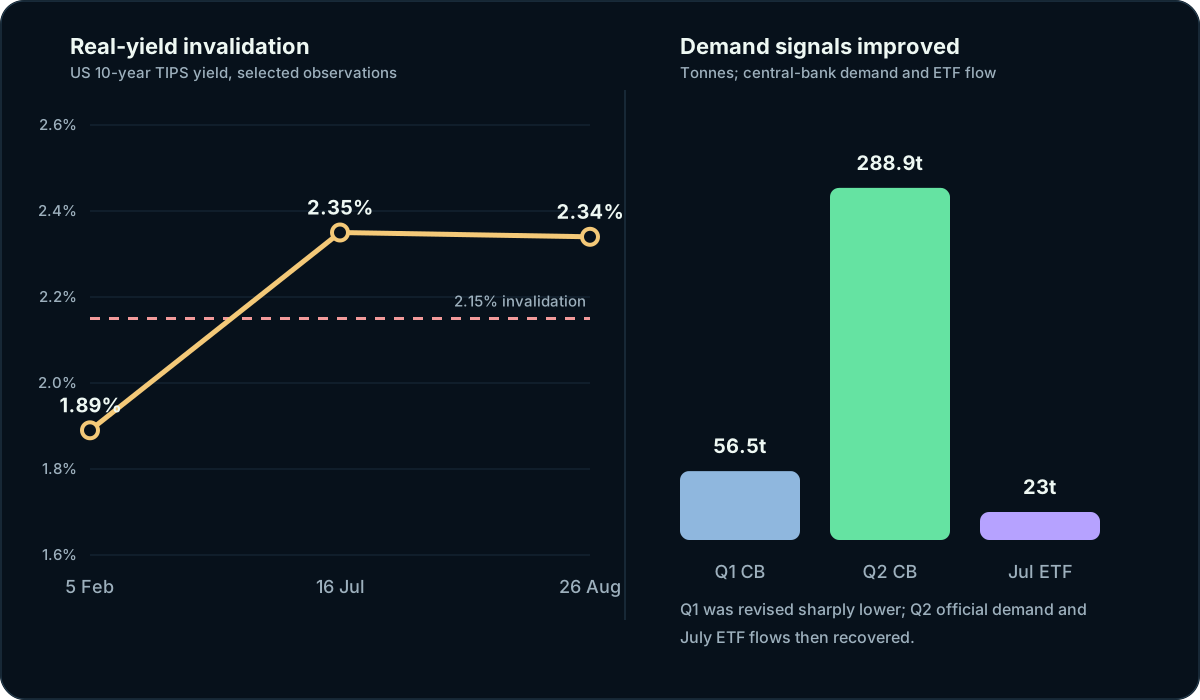
First, the World Gold Council revised Q1 central-bank demand down to 56.5 tonnes, then estimated 288.9 tonnes of net buying in Q2. The recovery was unusually strong, but the weaker first quarter left first-half demand at 345 tonnes, the lowest first-half total since 2022. The correct conclusion is therefore that official demand recovered, not that it was uniformly strong throughout 2026.
Second, global gold-backed ETFs added approximately $3bn and 23 tonnes in July, reversing two months of outflows. Chinese ETFs added 5 tonnes during July and approximately another 8 tonnes through 12 August. These flows show that investor demand can return quickly, but the first-half record also shows how concentrated liquidation episodes can overwhelm the physical bid.
Third, the People’s Bank of China reported a 20-tonne increase in July, taking its disclosed holdings to 2,366 tonnes. The purchase extended the reported accumulation streak to 21 months. This strengthens the reserve-diversification argument, while leaving open how much buying would persist at materially higher prices.
Why the View Is Not Bullish Yet#
Real Yields Remain Above the Prior Invalidation Level#
The 10-year US real yield was 2.34% on 26 August. That is slightly below 2.40% on 21 August, but still well above the 2.15% threshold used in the failed February thesis.
Gold can rise alongside high real yields when geopolitical demand, fiscal uncertainty or official purchases dominate. The relationship is not mechanical. However, a high real yield raises the cost of holding a non-yielding asset and makes Western ETF demand more sensitive to monetary-policy expectations and the dollar.
The August Rebound Is Still Flow-Sensitive#
World Gold Council analysis published on 20 August linked the move towards $4,400/oz to softer US data, a pickup in ETF flows and continued official buying, while characterising the rally as more tactical than broad-based. That distinction matters. A rally led by a narrow change in rates expectations can reverse if inflation, policy or the dollar reprices.
High Prices Constrain Some Physical Demand#
Q2 jewellery consumption fell 17% year on year to 278 tonnes. Bar and coin demand was steadier at 307 tonnes, but remained well below Q1. Structural demand therefore coexists with price elasticity in consumer channels; it should not be described as a universal price floor.
Decision Framework#
Scenario Framework#
| Scenario | Probability | Evidence required |
|---|---|---|
| Bear case | 25% | Real yields rise, the dollar strengthens and global ETF outflows resume |
| Base case | 50% | Official demand remains firm, but high yields keep gold range-bound and investor flows volatile |
| Bull case | 25% | Real yields fall materially while ETF and official demand strengthen at the same time |
The probabilities are judgemental and describe the relative balance of evidence rather than a statistical forecast.
Conclusion#
Gold’s structural case remains credible, but structural demand and tactical price validity are different questions. Q2 official buying, July ETF inflows and renewed Chinese accumulation reduce the case for a short. A 2.34% real yield, weak jewellery volumes and the still-tactical character of the August rebound reduce the case for a fresh long.
The appropriate stance is neutral over three to six months. The view would become bullish only if the opportunity cost falls or investor participation broadens without relying on another short-lived policy repricing.
Research Methodology#
This note triangulates official US real-yield data with World Gold Council demand, ETF and reported central-bank statistics. Revised Q1 data replace earlier preliminary estimates. Price references describe published benchmark context rather than an executable entry. Scenario probabilities are judgemental and no proprietary price model is used.
Data cut-off: 27 August 2026.
Sources#
- US Department of the Treasury — Daily Treasury Par Real Yield Curve Rates
- World Gold Council — Gold Demand Trends: Q2 2026
- World Gold Council — Q2 2026 Central Banks
- World Gold Council — July 2026 Gold ETF Flows
- World Gold Council — China Gold Market Update, August 2026
- World Gold Council — What Was Behind Gold’s August Rally
This research reflects information available through 27 August 2026. It is provided for educational and informational purposes only and does not constitute investment advice, a solicitation or a recommendation to transact in any security or commodity.