

Executive Summary#
Investment View#
The decision to remain bullish was not based on denying that the market regime had changed.
The late-January reversal mattered. Gold had become crowded, volatility had increased, and the announcement of a more hawkish Federal Reserve leadership candidate triggered a rapid repricing of policy expectations and the US dollar. Momentum-driven selling then amplified the move.
However, the daily US 10-year real yield did not show a sustained break higher at the time. It was 1.89% on both 29 January and 5 February. The market had repriced the expected policy path more violently than the observed 10-year real-yield data alone would suggest.
That distinction supported a conditional bullish view: the correction weakened the tactical setup, but it had not yet breached the macro invalidation threshold.
Positioning#
Recommended Position: Maintain a long Gold view
Publication Date: 5 February 2026
Updated Horizon: 3–6 Months
The Original Thesis#
The initial January thesis argued that gold was becoming more than a rate-cut trade.
Its core drivers were:
- The sensitivity of gold to inflation-adjusted yields
- Historically elevated central-bank purchases
- Large fiscal deficits and rising sovereign interest burdens
- Reserve diversification away from concentrated currency exposure
- Geopolitical demand for a liquid asset without sovereign credit risk
That thesis had produced a $6,000 target from a reference price around $5,400. The subsequent sell-off forced a narrower question:
Had the structural thesis failed, or had a crowded market experienced a severe tactical correction?
The February update chose the second interpretation—but only conditionally.
What Changed#
Federal Reserve Leadership Expectations#
The announcement that Kevin Warsh would be nominated as the next Federal Reserve chair was received as a hawkish policy signal.
Gold sold off as markets reassessed the likelihood of aggressive easing, while the US dollar strengthened. The move was particularly severe because it arrived after a rapid January rally and a build-up in speculative exposure.
The important correction to the original presentation is that the observed 10-year real yield did not surge above the risk threshold during this episode. FRED data show a yield of 1.89% on 5 February, compared with 1.89% on 29 January.
The shock therefore operated through expectations, currency strength and positioning before it appeared as a sustained rise in the daily 10-year TIPS yield.
Momentum and Liquidity#
The January rally had become unusually fast. Gold moved from approximately $5,000 to above $5,500 intraday within days before reversing.
That price action increased the risk of forced selling. When momentum broke, systematic strategies, options hedging and profit-taking could reinforce one another even if long-run physical demand remained intact.
The February update therefore had to acknowledge that structural demand was not equivalent to short-term price stability.
The Entry Point Improved, but the Risk Increased#
A lower price created more upside to the revised target range, but it did not automatically create a better trade.
The correction demonstrated that gold’s realised volatility had shifted materially higher. A bullish position after the drawdown therefore required tighter invalidation conditions and smaller risk than the original late-January recommendation.
The relevant question was not whether gold looked cheaper than its record high. It was whether the structural buyers remained present and whether real yields stayed below the level that would undermine the trade.
Why the Thesis Survived at the Time#
Central-Bank Demand Remained Historically Elevated#
Verified full-year data showed central banks purchased 863 tonnes in 2025. That was lower than the more than 1,000 tonnes assumed in the original January presentation, but it remained historically strong.
Poland added 102 tonnes during the year and was the largest reported buyer. China continued adding to its reserves, although at a slower disclosed pace.
This did not guarantee a price floor. The World Gold Council explicitly noted that record prices had made some official buyers more cautious. But the strategic rationale for diversification remained intact, making a complete collapse in official demand less likely than a simple momentum model would imply.
Real Yields Had Not Yet Invalidated the Trade#
The revised invalidation level was 2.15% on the US 10-year real yield.
At 1.89% on 5 February, the observed yield remained below that threshold. The policy shock had changed expectations, but the core monetary condition required to invalidate the trade had not yet occurred.
This supported maintaining a bullish bias, although it did not justify ignoring further increases in yields.
The Fiscal and Reserve-Diversification Case Was Unchanged#
The sell-off did not improve the US fiscal outlook or reduce the long-term interest burden associated with high public debt.
Nor did it remove the strategic incentive for reserve managers to hold assets outside any single sovereign liability system.
These themes were slow-moving. Their persistence supported the long-run allocation case even while short-term investor flows became unstable.
Dip Buying Appeared After the Correction#
Evidence published shortly after the February update showed that Chinese investors and consumers bought into the weakness.
The World Gold Council reported robust January withdrawals from the Shanghai Gold Exchange and record monthly additions of 38 tonnes to Chinese gold ETFs. It also noted that gold recovered above $5,000 after briefly falling below $4,500 in early February.
This evidence was not fully available at the precise publication moment and should therefore be treated as subsequent confirmation, not as information used to construct the original decision.
Revised Investment Thesis#
The revised thesis was narrower than the January call.
I no longer needed gold to move immediately to $6,000. The tactical objective was a recovery towards the prior high, represented by a target range of $5,450–$5,600.
The expected path was:
- Forced selling and momentum pressure began to fade.
- Gold stabilised after reclaiming the $4,800 area.
- Real yields remained below 2.15%.
- Official-sector and Asian investment demand absorbed supply.
- Prices recovered towards the late-January high.
This was a mean-reversion and thesis-reaffirmation trade, not a new structural argument.
Key Catalysts#
Principal Risks#
The $4,800 Area Failed to Hold#
The original presentation treated $4,800 as tactical support. Because gold had already traded below that level during the early-February volatility, the more disciplined interpretation was that the market needed to reclaim and hold the area.
A renewed break would indicate that the rebound was unstable.
Real Yields Rose Above 2.15%#
This was the clearest macro invalidation. A sustained move above 2.15% would increase gold’s opportunity cost and show that the hawkish repricing had moved from expectations into the realised yield structure.
Central-Bank Demand Slowed#
The thesis relied on official-sector demand remaining historically elevated. A visible slowdown from Poland, China or the broader central-bank complex would weaken the structural bid.
Positioning Deleveraged Further#
A crowded market can continue falling even when long-run fundamentals appear attractive. Additional futures, options or ETF liquidation could overwhelm physical buying over shorter periods.
The US Dollar Strengthened Persistently#
A durable dollar rally would tighten global liquidity and create a direct headwind for dollar-denominated gold.
Investment Conclusion#
The February decision to remain bullish was analytically defensible at the time because the stated macro invalidation had not yet occurred.
Real yields remained below 2.15%, central-bank demand was still historically elevated, and the fiscal and reserve-diversification arguments were unchanged. The correction could therefore be interpreted as a positioning shock rather than immediate proof that the structural thesis had failed.
However, the revised position was materially riskier than the original article suggested. The support level had already been tested, volatility had increased sharply, and the target depended on a rapid normalisation in momentum.
The correct conclusion was not that the sell-off did not matter. It was that the sell-off had changed the trade from a breakout thesis into a conditional recovery thesis.
Research Methodology#
This review distinguishes between:
- Information available on 5 February 2026: the original price framework, full-year 2025 demand data and the daily real-yield level
- Subsequent confirmation: Chinese ETF flows, physical demand and the documented depth of the early-February correction
- Outcome evidence: the later price path and whether the 2.15% real-yield invalidation was triggered
The original Queen’s Tower Capital presentation was used to preserve the historical recommendation. External data were used to verify or correct the market figures and to prevent later information from being presented as though it had been available at publication.
Outcome and Reflection#
The revised $5,450–$5,600 target was not achieved within the stated 3–6 month horizon.
Gold recovered from the early-February correction and ended February at approximately $5,222/oz, but it did not return to the late-January record. It subsequently experienced another severe decline, briefly falling below $4,000/oz in late June.
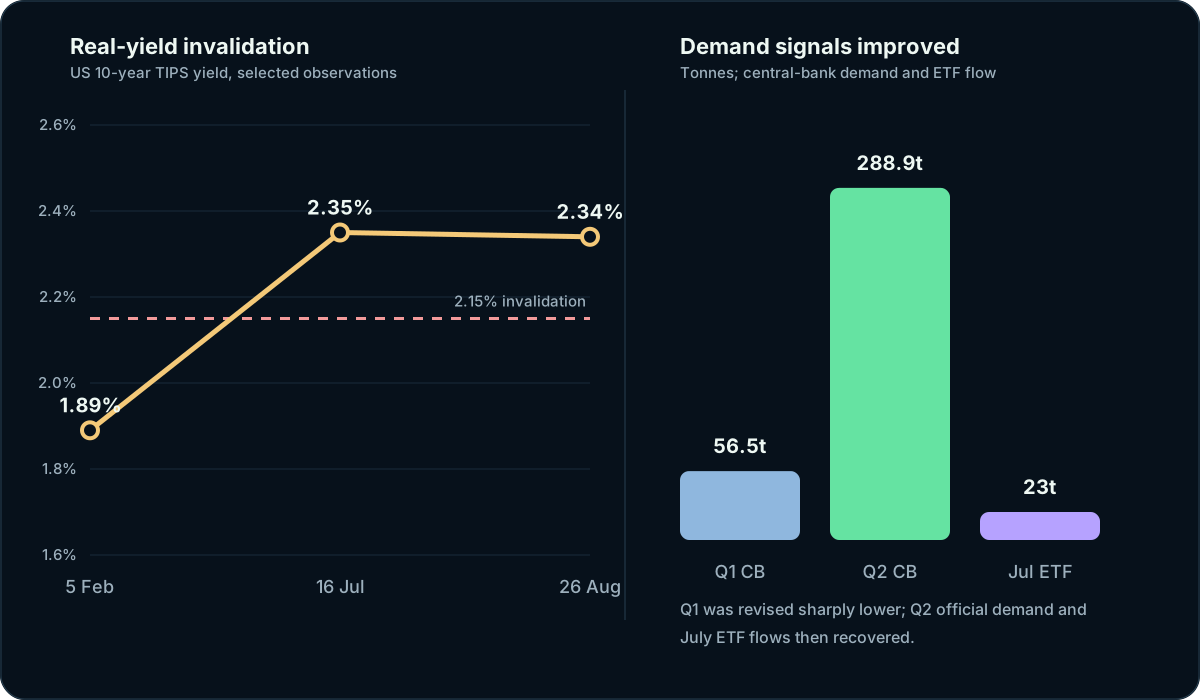
The real-yield invalidation was eventually triggered. The US 10-year real yield rose above 2.15% during May and June and reached 2.35% by 16 July.
The structural demand thesis again proved more resilient than the tactical price call, but the preliminary demand evidence was revised materially. The World Gold Council’s Q2 release reduced estimated Q1 central-bank demand to 56.5 tonnes, then estimated a rebound to 288.9 tonnes in Q2. That sequence does not rescue the failed trade; it shows why current official demand should be separated from the evidence available during the original horizon.
The February call should therefore be recorded as unsuccessful:
- The target was not reached
- The stated real-yield invalidation was later breached
- The correction was not merely temporary within the full investment horizon
- Structural demand remained strong, but it did not dominate positioning and opportunity-cost pressures
The main process lesson is that reaffirming a thesis after a drawdown requires more than restating the original argument. The update should specify what changed, reduce exposure to reflect higher volatility, and act immediately when the revised invalidation condition is met.
A current bullish or mildly bullish view on gold would therefore need to be treated as a new thesis with a new entry level and horizon, not as an uninterrupted continuation of this February trade.
Sources#
- World Gold Council — Gold Demand Trends: Q4 and Full Year 2025
- World Gold Council — Central-bank demand in 2025
- Federal Reserve Bank of St. Louis — US 10-year inflation-indexed Treasury yield
- World Gold Council — China gold market update, February 2026
- World Gold Council — February 2026 Gold Market Commentary
- World Gold Council — Gold Mid-Year Outlook 2026
- World Gold Council — Q1 2026 central-bank demand
- World Gold Council — June 2026 ETF flows
- World Gold Council — Gold Demand Trends: Q2 2026
Originally researched and prepared by Srinivas Medida while serving as Commodities Sector Head at Queen’s Tower Capital, Imperial College Investment Society. Revised and expanded for publication on SM Research. Material public-market figures were checked against the sources listed below; contemporaneous presentation figures are identified as such. The investment view reflects the assessment made on 5 February 2026; the outcome evidence was last checked on 27 August 2026. This material is provided for educational and informational purposes only and does not constitute investment advice or a recommendation to buy or sell any financial instrument.