

Research Question
Does the relationship between commodity returns and the returns of commodity-producer equities change when inflation is already elevated? The project studies Brent crude against US energy equities, and gold and copper against US metals-and-mining equities.
Why the Original Model Was Revised
The initial workflow forward-filled missing monthly futures prices before calculating returns. That produced observations in which Brent, gold and copper returns were all exactly zero while the producer-equity ETFs moved. Treating those rows as genuine observations would mechanically weaken the estimated commodity-equity relationships. The current exclusion count is read directly from the generated audit output below.
The revised project excludes those artificial rows, retains a full data-quality log and replaces separate regime regressions with a single interaction specification. The original script and report remain in the downloadable archive so that the change in methodology is visible.
Revised Specification
- Prepared rows
- 104
- Excluded artefacts
- 14
- Model observations
- 89
- Usable sample
- May 2017–Dec 2025
Brent
Brent → energy equities
Gold
Gold → mining equities
Copper
Copper → mining equities
High inflation is defined using the previous month’s headline CPI rate, with 3% as the primary threshold.
Energy and mining ETF returns are regressed on Brent, gold and copper returns, an inflation-regime indicator, three interaction terms and the monthly change in the US 10-year Treasury yield.
Statistical inference uses Newey-West heteroskedasticity and autocorrelation-consistent standard errors with three lags.
Robustness tests repeat the model at the 2.68% sample-median threshold and at 3%, 3.5% and 4% CPI thresholds.
Primary Results
| Relationship | Lower inflation | High inflation | Difference | HAC p-value |
|---|---|---|---|---|
| Brent → energy equities | -0.030 | 0.493 | 0.523 | 0.016 |
| Gold → mining equities | 0.298 | 0.516 | 0.219 | 0.680 |
| Copper → mining equities | 0.428 | 0.757 | 0.328 | 0.355 |
Figures are read directly from the Python-generated output at build time. Gold and copper are coefficients from the same multivariate MiningETF model, which is why they share the model-level R² in the downloadable CSV.
The narrow defensible result is that Brent returns had a materially stronger relationship with energy-equity returns when inflation was already elevated. The corrected model does not support a statistically reliable inflation-regime shift for gold. Copper remains positively associated with mining equities, but its regime difference is not precise at the primary threshold.
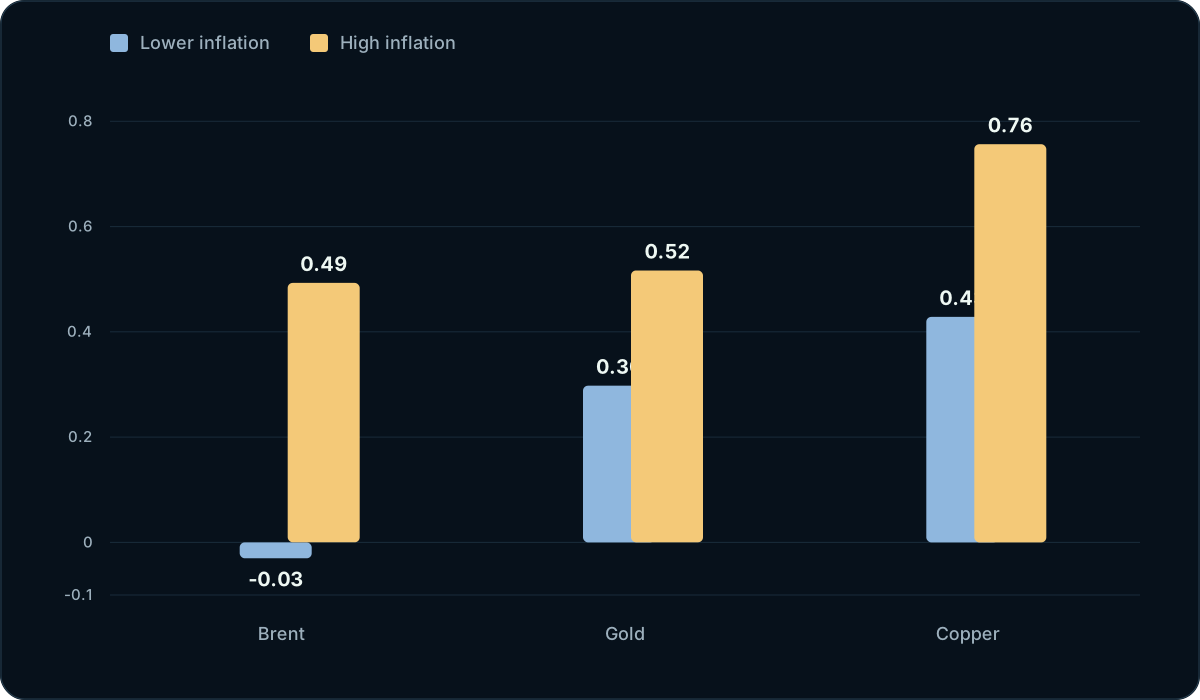
Primary 3% threshold estimates: Brent, gold and copper sensitivities under lower- and higher-inflation regimes.
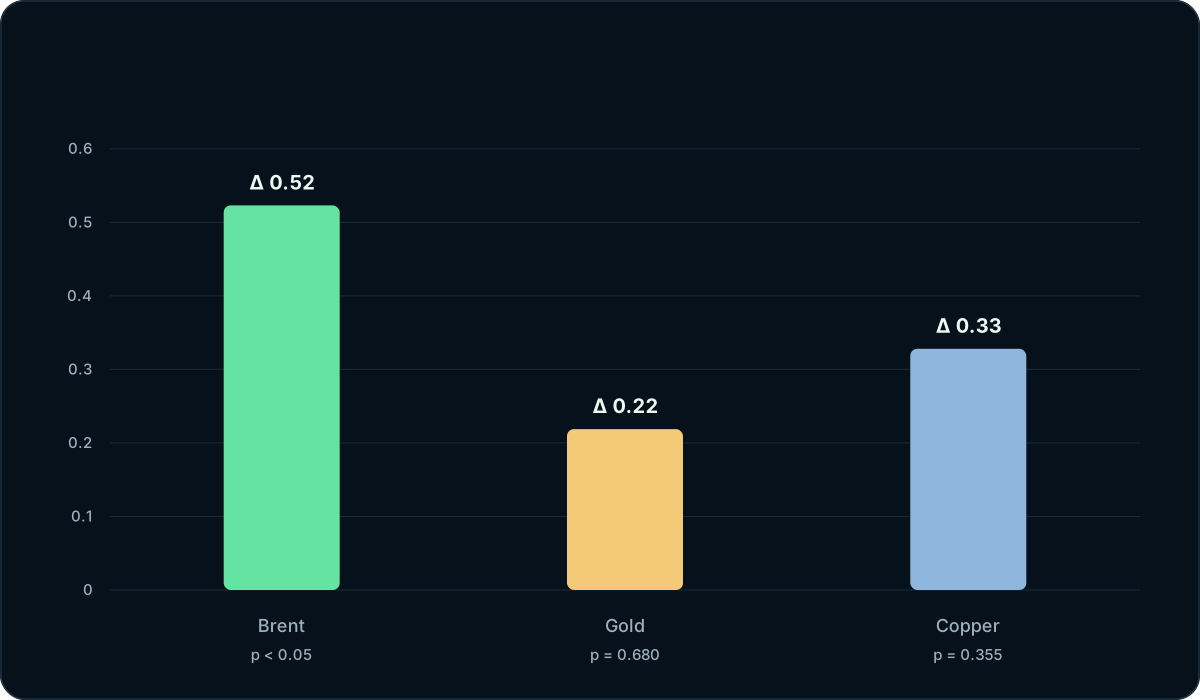
The economically strongest and statistically cleanest result is the positive Brent regime effect.
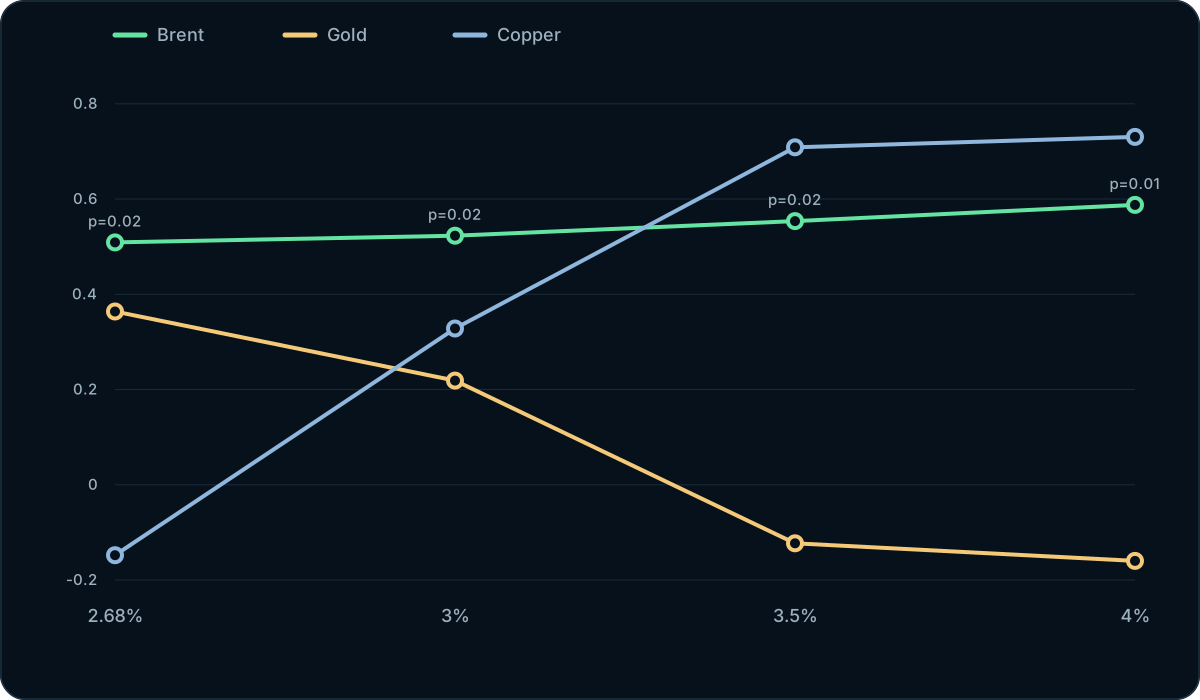
Robustness across lagged-CPI thresholds: Brent remains positive and significant, while copper becomes material only at the higher thresholds.
Robustness and Interpretation
The Brent interaction remains positive and statistically significant across all four tested inflation thresholds. Copper’s interaction becomes significant only at higher thresholds, so that result is sensitive to the chosen regime boundary. The models identify conditional associations, not causal effects.
Limitations
The retained market dataset contains prepared monthly returns rather than the original adjusted-close price series.
XLE and XME are imperfect producer-equity proxies and contain company-specific and index-composition effects.
The sample is modest, and isolated significant results should be interpreted cautiously in a multiple-testing setting.
The regressions estimate same-month sensitivity, not a predictive trading signal. A strategy-oriented extension would require lagged features, walk-forward testing, transaction costs and a genuinely out-of-sample evaluation.
Inflation thresholds are modelling choices rather than natural economic boundaries.
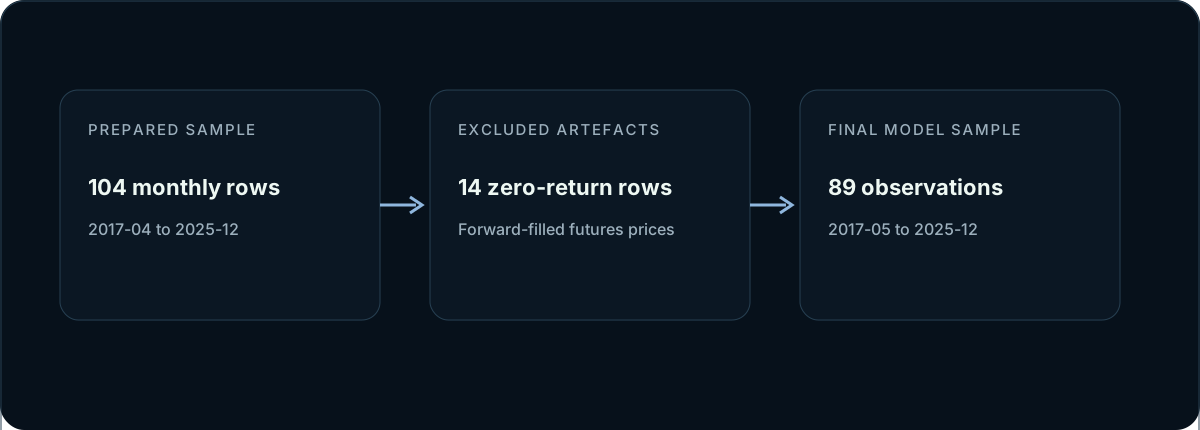
The corrected release makes the data audit visible: the usable sample is smaller, but the modelling choices are reviewable and reproducible.
Files and Reproducibility
The public package contains the audited dataset, exclusion log, Python analysis, complete regression output, threshold tests, figures, methodology notes and an Excel review model. The Excel workbook displays the Python-generated HAC estimates and exposes the data-quality and specification choices in a reviewable format.
This project is an empirical association study, not a causal estimate or an investment recommendation.