

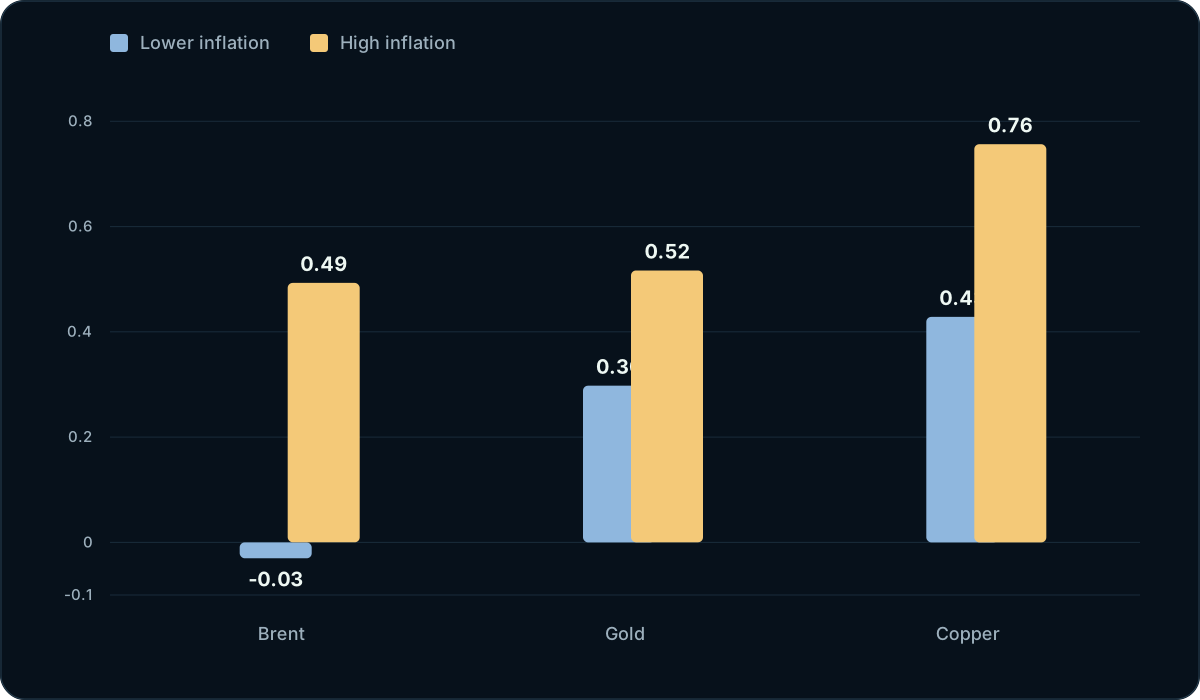
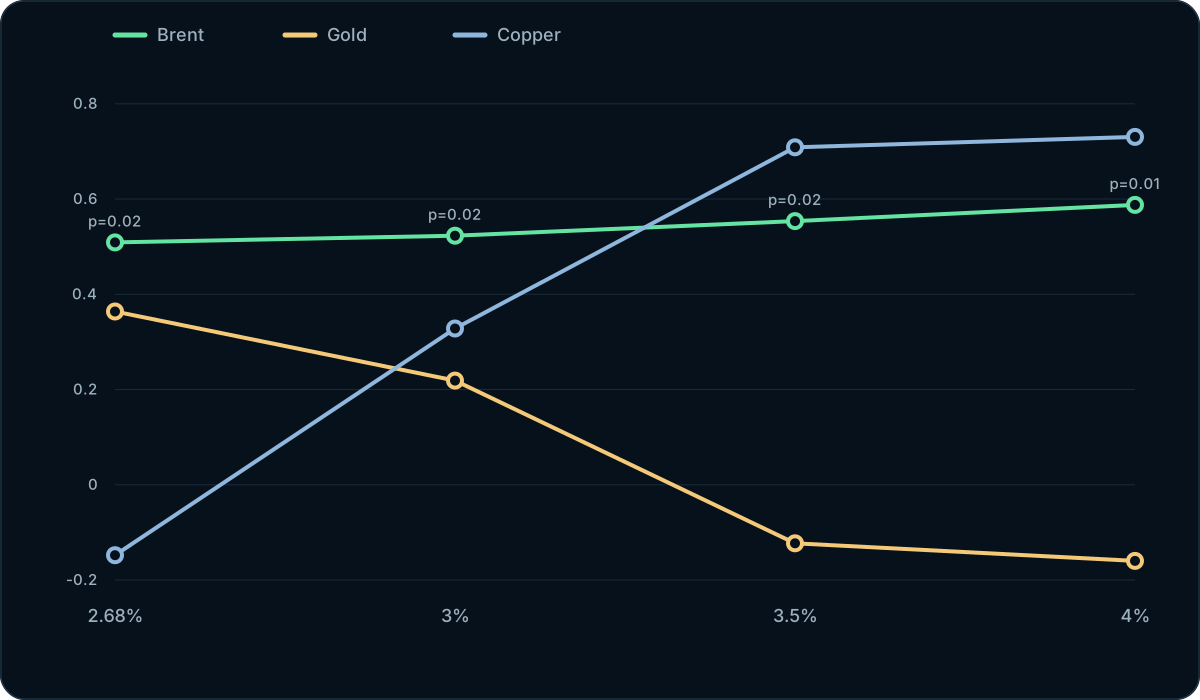
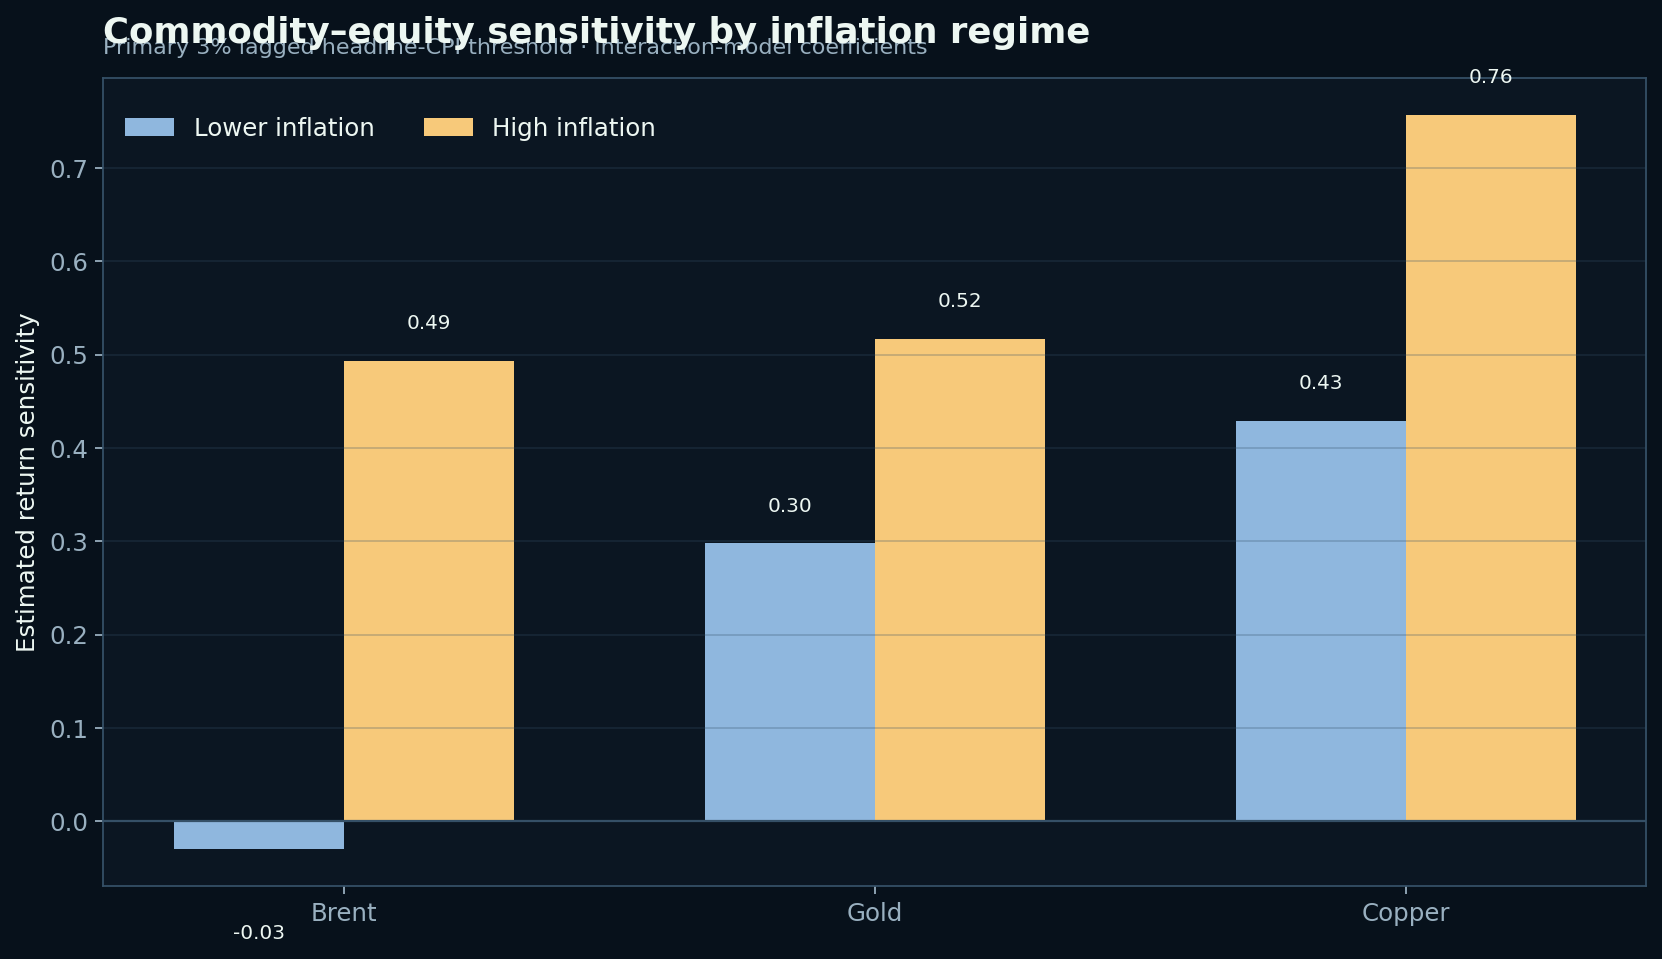
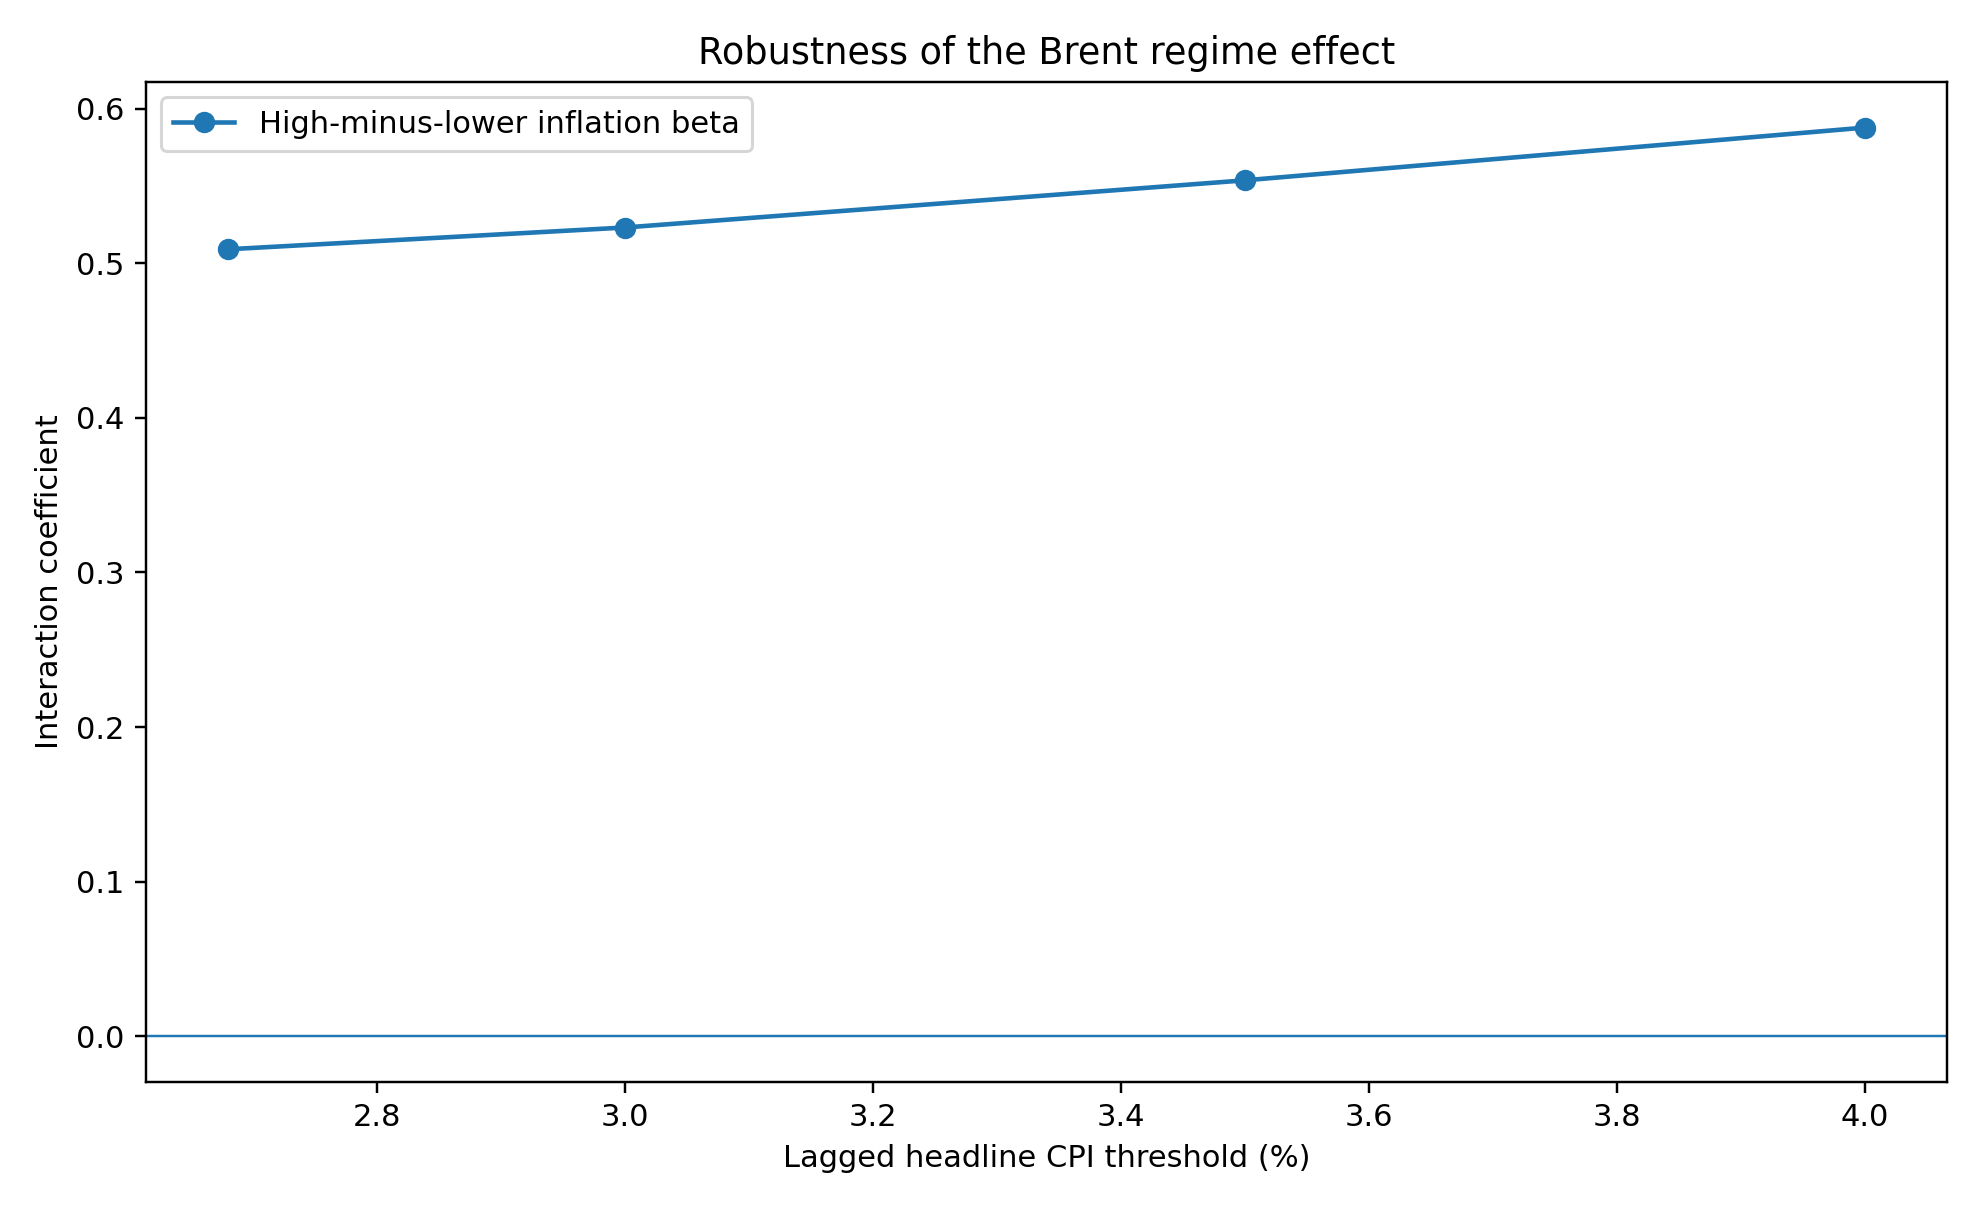
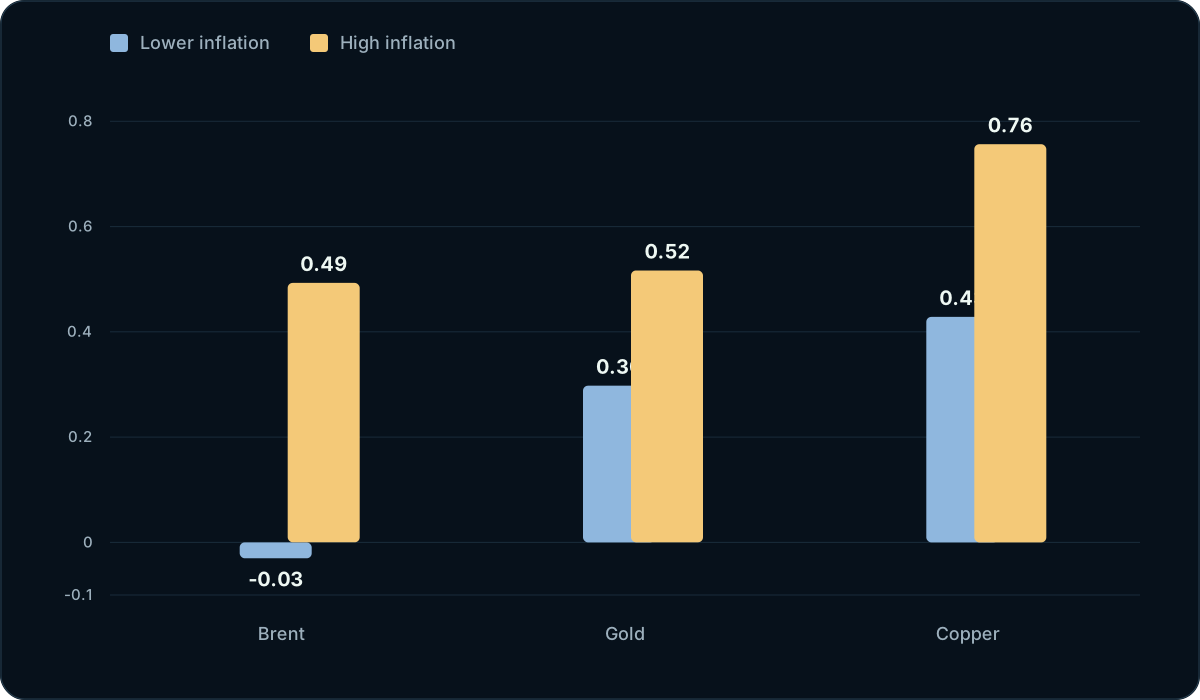
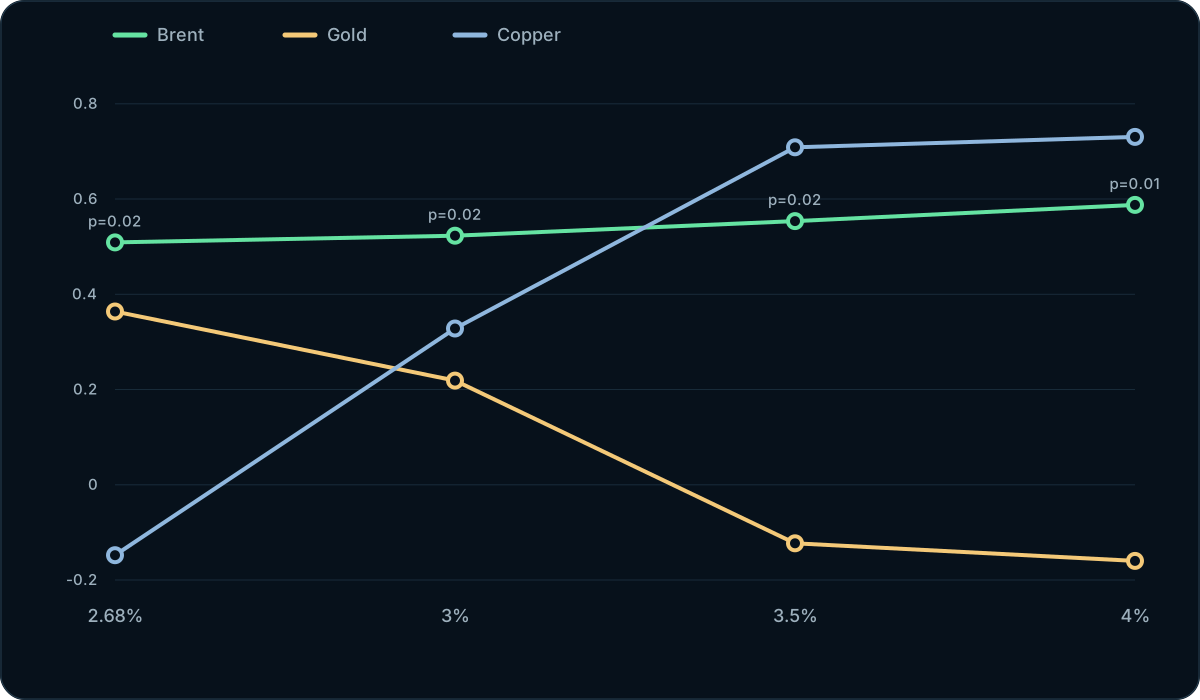
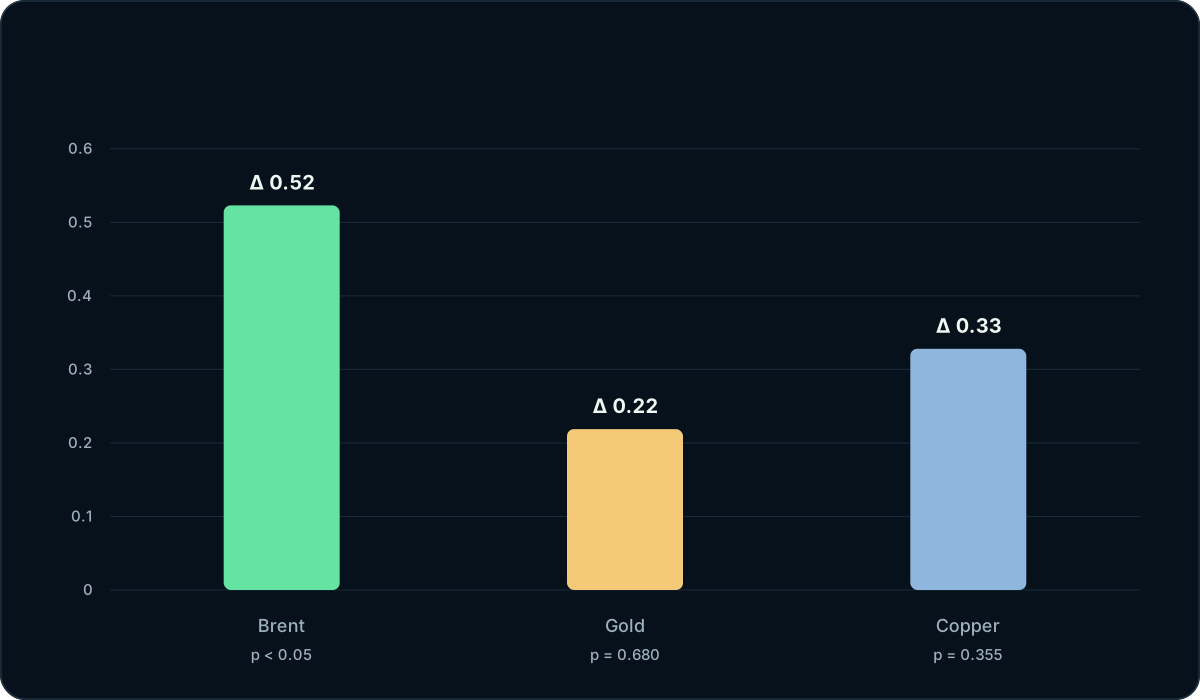
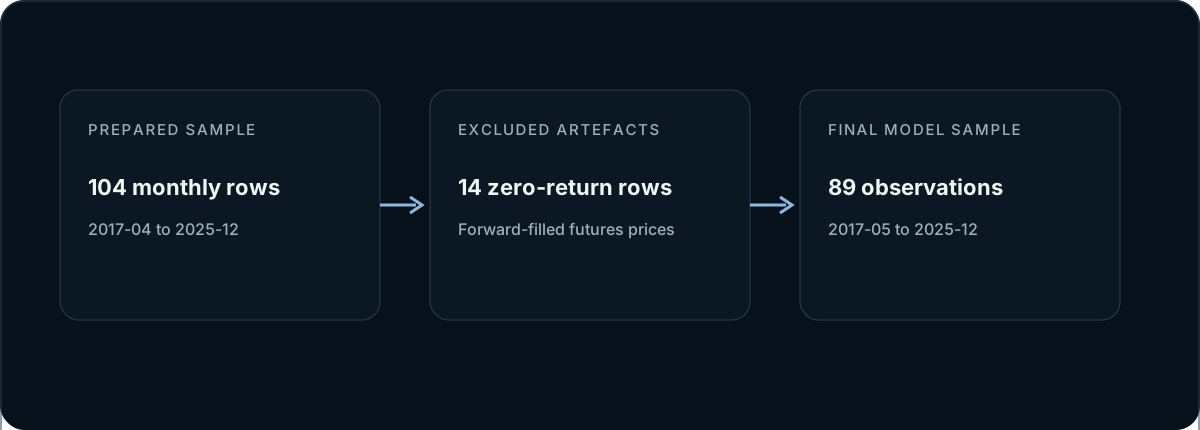
This page exposes the corrected research workflow rather than only a finished chart. The project includes the retained input data, the exclusion log, the final model sample, regression output and the Excel review model.
Documentation
Methodology, findings, sources and the correction record.
Code and model
The reproducible Python workflow and Excel review model.
Data audit
The retained input, audit trail and final model sample.
Results and figures
Regression output, robustness checks and published charts.
Complete archiveCode, model, retained data and documentation
Download full project ↓This is an empirical association study, not a causal estimate or an investment recommendation. The earliest workflow did not retain the original adjusted-close series; the corrected release is reproduced from the preserved monthly-return dataset and documents that limitation explicitly.